Introduction
- 13 Jul 2022
- 2 Minutes to read
- Contributors

- Print
- DarkLight
Introduction
- Updated on 13 Jul 2022
- 2 Minutes to read
- Contributors
- Print
- DarkLight
Article summary
Did you find this summary helpful?
Thank you for your feedback!
The internal scanner is responsible for scanning a companies internal network. This includes everything behind the firewall such as cameras , printers, switches, routers, desktops , and more. In addition to performing network scans the internal scanner will assess the active directory environment as well.
The internal scanner requires a single agent to be installed on the companies network. From there a black box approach is taken and all other devices connected to the network will be discovered and scanned. If you are testing active directory you must supply the platform with a user that has normal access rights.
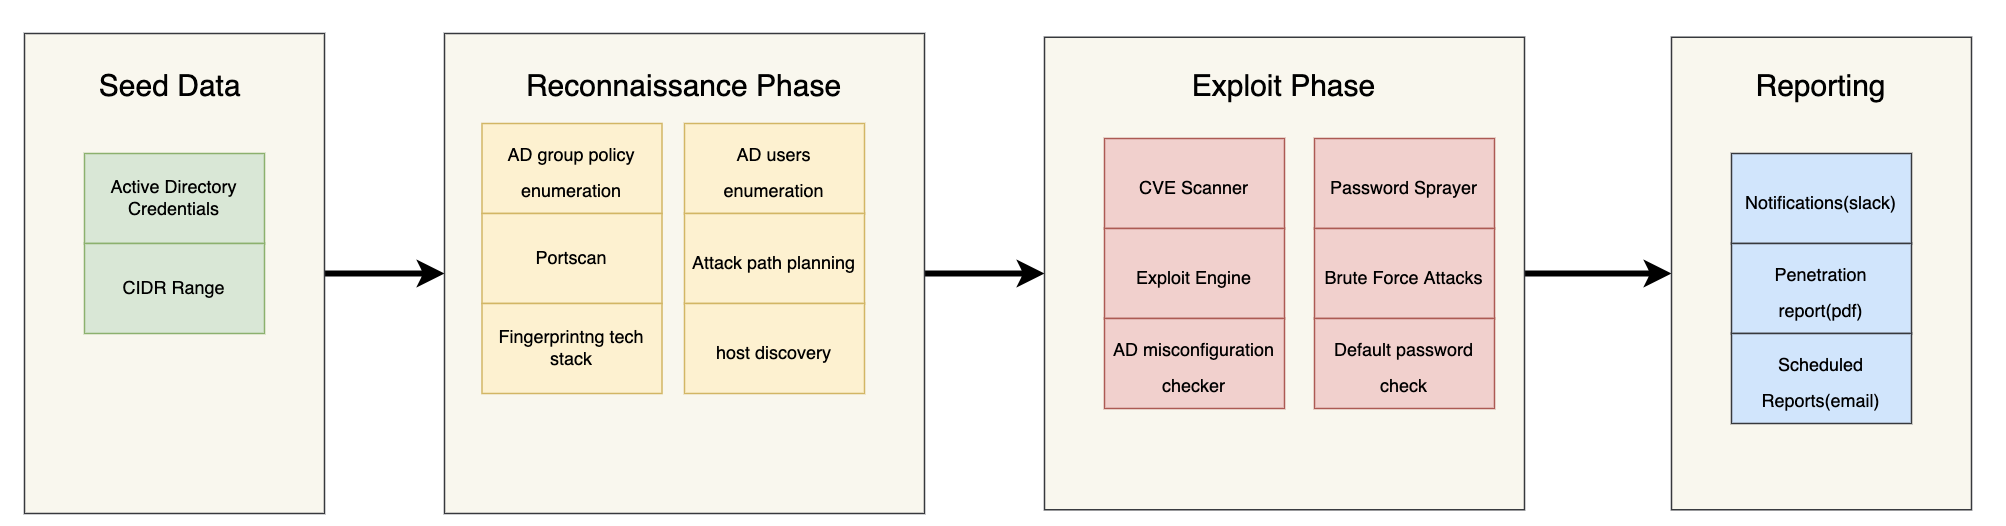
As shown in the image above users only have to supply the initial seed data and the tool will automate the rest of the process. The platform is designed to mimic hackers/penetration testers so naturally it follows goes though the same phases as them. During the recon phase the tool is looking for additional assets, discovering which ports are live and the services running on them, determine the tech stack of application and services, enumerating active directory, and much more.
After the recon phase the platform moves to the exploit phase. Here the platform uses the information gathered earlier to test for security weaknesses and vulnerabilities. This can include looking for CVEs, testing for common active directory vulnerabilities such as LLMNR poisoning and kerberoasting, testing printers/routers/cameras and other devices for default passwords, running brute force attacks , and much more.
Finally, after a scan has completed you can download a penetration test report of your vulnerabilities as exploits. This report can also be scheduled to send to you daily, weekly, or what ever time you decide to pick. In addition to reports you can also get notified when a new exploit is found by integrating into slack and other third party tools.
Once you setup you'r sentry via the onboarding process and initiate a scan on the sentry you should see a screen as shown below. To get to the internal sentries list click the "Sentry" tab in the left side bar.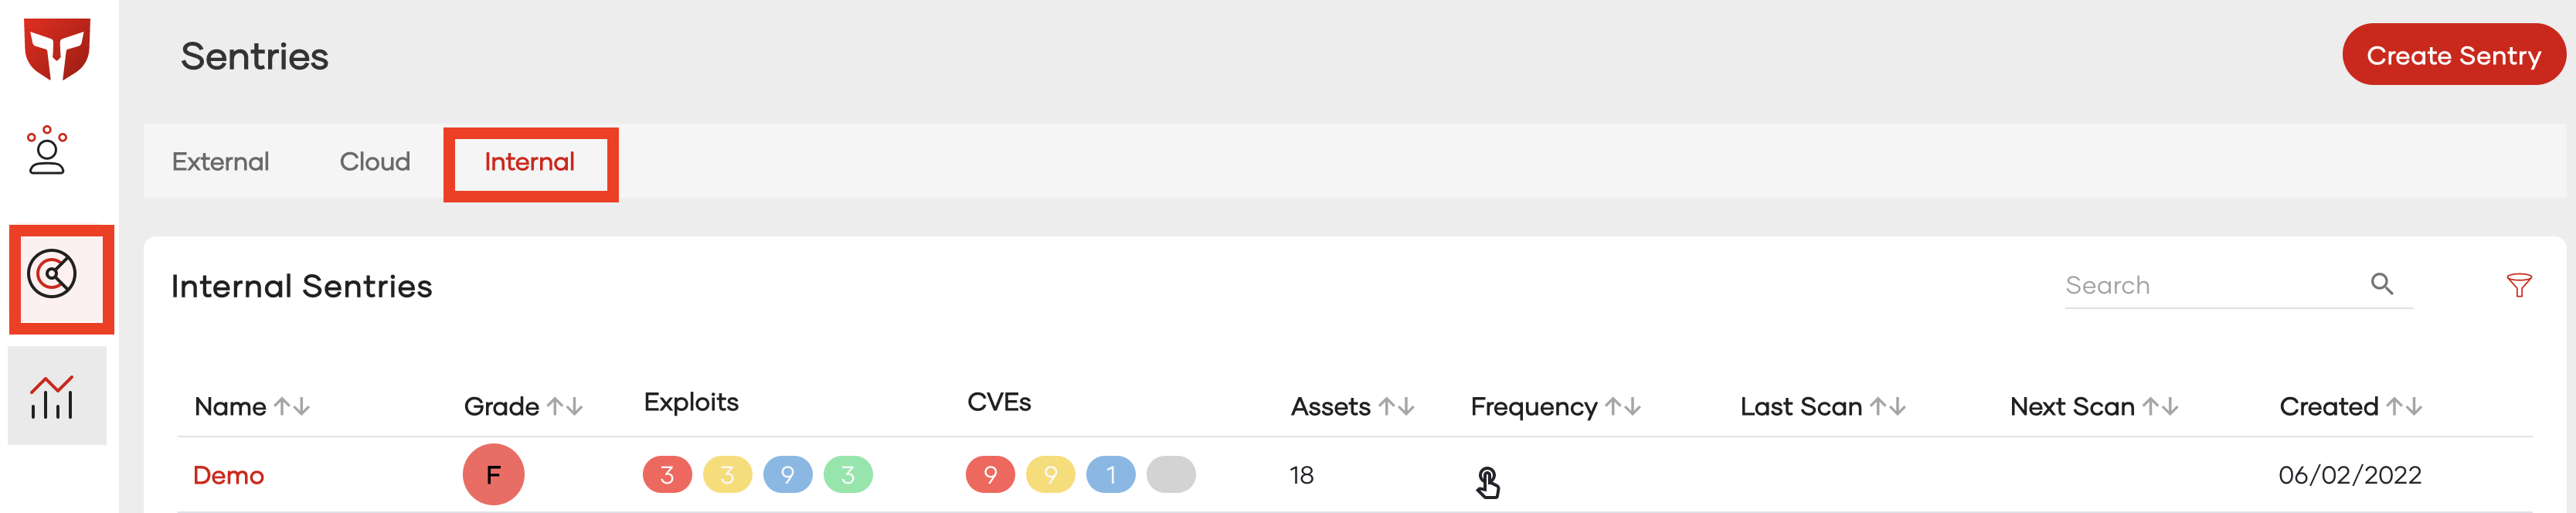
If you click the "Create Sentry" button you will be taken to the onboarding process where you can create and setup an internal sentry. More information on this process can be found in the "Onboarding" document.
This page also lists all internal sentries belonging to your team. If you cant see a created sentry make sure you have been added to the sentries ACL, more information on this can be found in the ACL documentation. Each row corresponds to a separate sentry and it always displays your cyber security letter grade, found exploits, found CVEs, and found Assets. To get a deeper look at a sentry click on the sentries name.
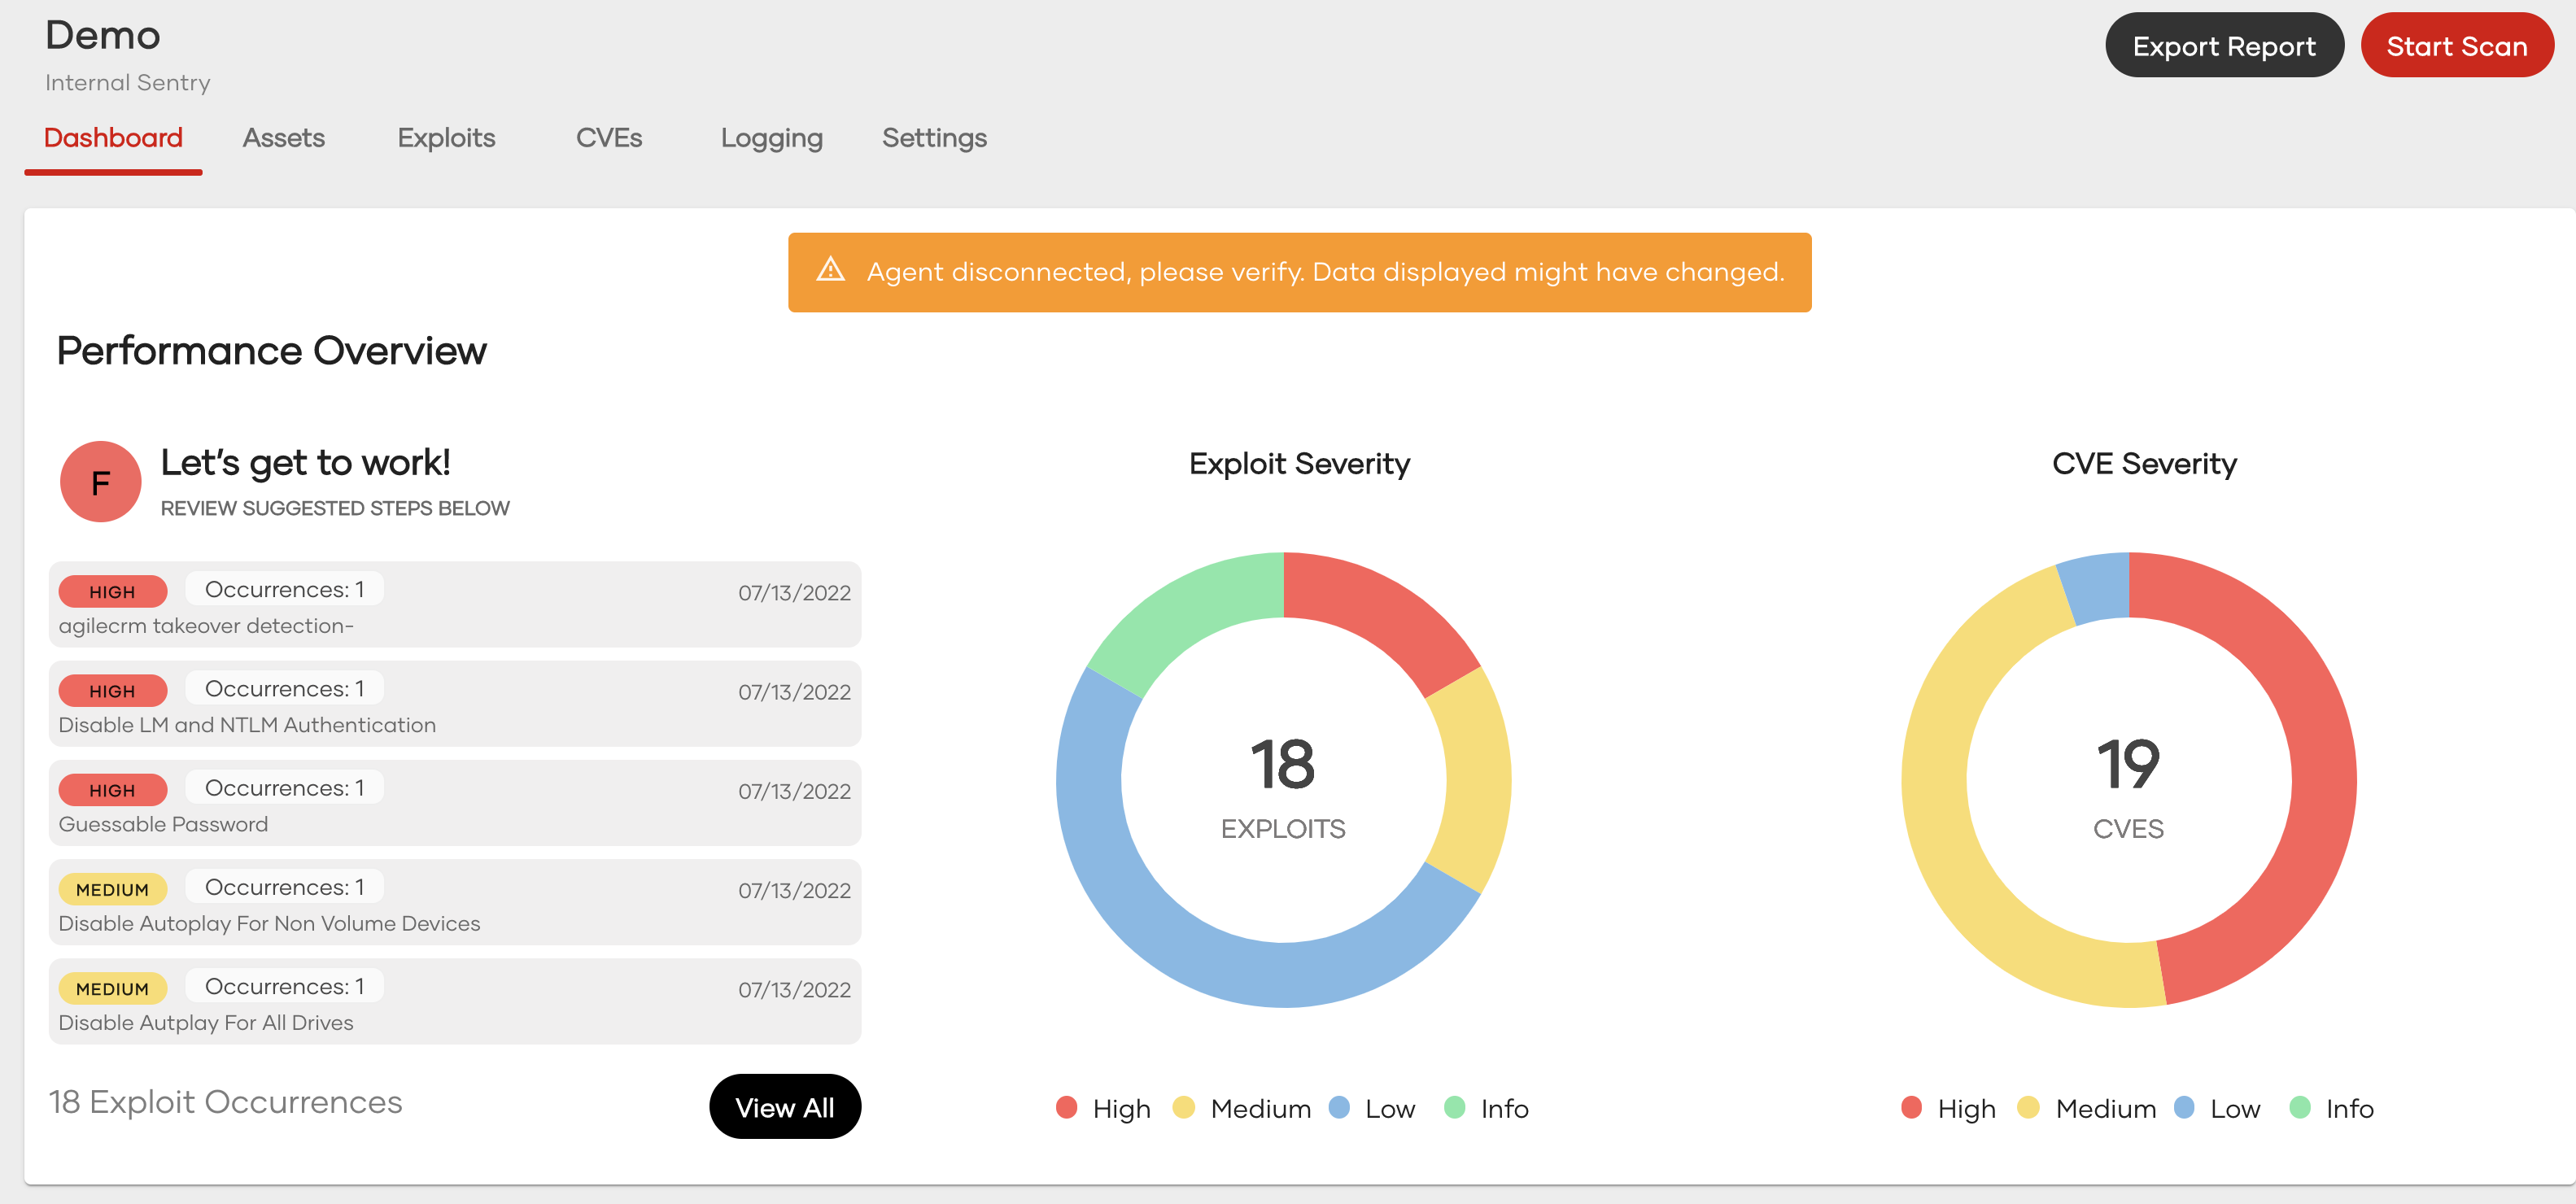
As shown above by clicking on the sentry you are brought to the dashboard. Here you can export reports, initiate scans, and view the scan results. Also note the warning message "Agent disconnected, please verify. Data displayed might have changed".This message means the agent is disconnected, to start the agent run the executable locally on a machine within the companies network. here are several pages and features within the external scanner more information about each tab can be found in the corresponding documents.
Was this article helpful?